LeBron Has Averaged 27–7–7 For 15 Years. Why Hasn’t He Had a 27–7–7 Game Then?
A Statistical Analysis of the Probability of LeBron Having a 27–7–7 Game

You’ll never win a ring. You’ll never beat the Warriors. You’ll never catch Michael. LeBron has heard it all before and has proved it all wrong in turn. He made it out of Akron to the NBA, brought a championship to Cleveland, and is inching closer and closer to GOAT status by the day. Tell him how low the odds are and he’ll laugh in your face, because he has accomplished almost everything that there is to accomplish. Almost.
There seems to be only one thing that eludes LeBron, and that is a 27–7–7 game.
LeBron is famous for his consistency. Over his 15-year career, he has hovered around his career averages of 27 points, 7 assists, and 7 rebounds. Night in and night out, he has delivered statlines that would make career nights for 90% of the NBA. Their peak is LeBron’s everyday. The below plot shows his season averages in these three main statistical categories over his career.

LeBron has been delivering season averages of 27–7–7 longer than 2 billion humans have been alive. To be specific, he has averaged 27.2p/7.2a/7.4r over his entire career. Still, not even once in his 1,121 regular season games has he had exactly 27–7–7. What are the odds of that?
Multivariate Normal Distribution
Statisticians have long been concerned with the probability of events happening. What are the odds it will rain? What are the odds I’ll find a girlfriend? (Hint: Not likely given the content of this post)
In particular, statisticians have studied the probabilities of correlated events. What are the odds the stock price of American Airlines AND Southwest go up? What are the odds LeBron has 27 points AND 7 assists AND 7 rebounds? These questions can all be answered with something called the “Multivariate Normal Distribution.”
The normal distribution is well known. It’s commonly called a bell curve, every stats class is filled with pictures of it, and it naturally shows up in many areas of life. Below is a histogram of all LeBron’s regular-season point totals, and it is in fact approximately normally distributed.

By assuming LeBron’s scoring follows this curve, we can estimate the probability of LeBron getting exactly 27 points in a game. Repeating this process for assists and rebounds, we would have the probability of each individual event of the 27–7–7 game happening. So we should be able to multiply it all together and get the probability of a 27–7–7 game, right? What’s the issue?
The problem is the fact that these events are correlated. Just like peanut butter & jelly or thunder & lightning, performances in NBA games go together. If LeBron scores more, he’s likely to have less assists. If LeBron has more rebounds, he’s likely to have more points. These events aren’t independent of each other. The full correlation matrix is below.

What the Multivariate Normal Distribution does is account for how these three values play off each other. Think of it as the bell curve for multiple variables, because that’s exactly what it is. With it, it is fairly straightforward to estimate the probability of a 27–7–7 game given a few palatable assumptions.
Get to the point, what are the odds?
Although LeBron is a cyborg in consistency, each of his years are not quite the same. To determine the odds of LeBron having made it this far without a 27–7–7 game, I fit a Multivariate Normal Distribution (MVN) to each year separately. Then, I multiplied a few numbers, multiplied some more, and ba da bing ba da boom, we got our odds!
The probability that LeBron would make it this far in his career without a 27–7–7 game is 32%.
So it was more likely to happen than not, but sometimes things with a roughly 30% chance of happening actually do happen.
The below plot shows the cumulative probability that LeBron would not have a 27–7–7 game over his career.

Only passing the 50% mark in 2012, it seems that 27–7–7 games shouldn’t be expected very often, but they also aren’t vanishingly rare.
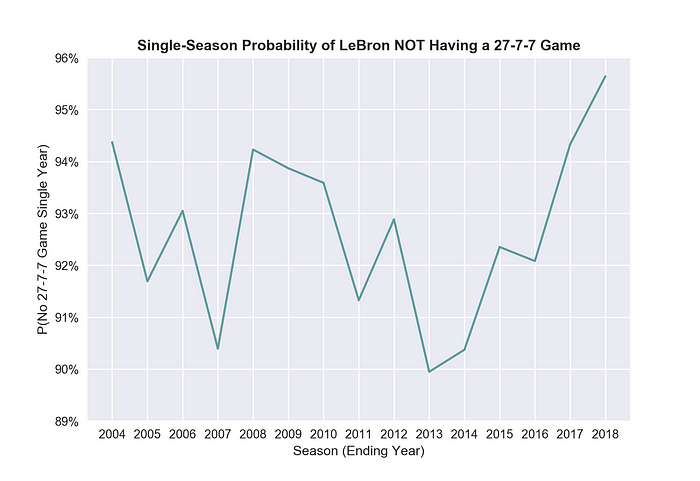
Each of LeBron’s years are similar, but not exactly the same. The below plot shows the odds that LeBron would not have a 27–7–7 game each individual season.

Each year is between 90% and 95% while the odds of a 27–7–7 game seem to be getting slimmer as LeBron ages. While one would expect smaller statlines as a player ages, LeBron is the exception. His brilliance is actually holding himself back. In the 2017–2018 season, LeBron averaged 27.5/9.1/8.6, which means he gets too many rebounds and assists for a 27–7–7 game!
The below plot extends the above plot 7 years under the assumption that LeBron plays 60 games a season and has statlines like last season.

If LeBron ends up without a 27–7–7 game at the end of his career, we will look back and say there was roughly a 20–30% chance of that happening. Not likely, but not a statistical anomaly.
But we live in the present, and the past odds don’t matter anymore. The below plot shows the odds LeBron will record a 27–7–7 game under the same assumptions as before, starting from today instead.

There is an 80–85% chance that LeBron will not have a 27–7–7 game from here on out. So, don’t hold your breath for anything, but still appreciate the greatness. #RWTW
Documentation
Everything in this post can be replicated from my GitHub repository: https://github.com/DastonArman/lebron_multivariate#lebron_multivariate
Using a few python libraries, I scraped Basketball Reference for data, fit some MVN distributions, and made some simple plots. Feel free to copy anything or just look through!
Reddit Post; https://www.reddit.com/r/nba/comments/96hp4p/oc_lebron_has_averaged_2777_for_15_years_why/